
 25032
25032
Background
In this article, you’ll find information on the adhoc reporting tool connected to HMIS: Looker. Looker can be used to explore your HMIS data in ways not captured by canned reports that are available in HMIS. Learning how to use Looker involves curiosity, patience, and experimentation. Looker’s powerful functionalities can be harnessed by any HMIS user who wants to use data to make informed decisions.
Note: this guide follows the HMIS Monthly Training for Looker (see recording), which means the sections in this guide build on each other. It is recommended to read the entire article from start to finish at least once.
Topics
What is Looker?
How to Think Like Looker
The Data Analysis Process
- Accessing Looker
- Looker Models
- Looker Report Screen
- Field Pane
- Filtering
- Data Pane
- Dimensions vs. Measures
- Selecting Fields
- Screen Specific Fields
What is Looker?
Sometimes you may see different terms to refer to Looker. These three common terms are:
- Looker - The name of the product, which is owned by Google. If you visit the Looker knowledge base articles linked within this article you’ll notice Google’s branding.
- Explore Tab/Data Analysis Tab - Some of 211OC’s HMIS Knowledge Base articles refer to the Explore tab in order to be clear on how to get to the page where you can create reports in Looker. You’ll also see materials that refer to the Data Analysis Tab, which is where reports in Looker created by you or 211OC will be stored when they are saved.
- Data Analysis Tool - This is the preferred terminology used by Bitfocus, our HMIS vendor.
However you refer to it, Looker is a tool for exploring and explaining your data. Each piece of data you put into HMIS, such as Universal Data Elements like clients’ dates of birth, gender, race, ethnicity, etc., or Project Specific Data Elements such as disability information and income information, can be explored in Looker to gain insight into the clients your agency serves and the services your agency provides. Exploring can be thought of as the process of creating reports and explaining can be thought of as the process of using reports to influence decision making.
How to Think Like Looker
The Data Analysis Process
In order to use Looker effectively, you need to understand the process of data analysis. Below is a simplified timeline of the data analysis process. In reality, there is often a lot of movement back and forth between steps one and two before reaching step three: insight.
- Data - Data is a collection of facts, numbers, and other details in a raw or unprocessed format. The data analysis process begins when you have figured out the data you need to begin your exploration and have it in a table format of columns and rows.
- Information - After processing your data, you are left with information. Usually, this is descriptions of data in short sentence form. Where a table of data is jumbled and hard to make sense of, information from processing that data leaves you with descriptions of your data.
- Insight - Insight happens when the information you’ve gleaned from your data is used to uncover a pattern in the data and make a decision.
See more on the data analysis process here.
Let’s look at an example of the data analysis process:
Data

This table is fictional data composed of client identifiers, clients’ project start dates, and whether or not the client receives SNAP (CalFresh) benefits. This data was pulled from Looker after a case manager noticed that towards the end of the month she tends to frequently work with clients on food assistance. Since some benefits programs disburse between the first and tenth of each month, there may be a pattern to her observation that can be seen in HMIS data, and the case manager thought it would be a good idea to start focusing on connecting clients to CalFresh.
Looking only at the table in its raw unprocessed form, you’re probably not getting much out of it. This is the "data" part of data analysis. No analysis has been done yet, and we don’t immediately see any information.
Information

Upon creating a simple PivotTable in Excel (which is functionality also available in Looker) we can see that the majority of clients who enrolled during the month of July already have CalFresh and those with CalFresh enrolled in the project on or after the 15th. This is interesting, but is still just “information.”
Insight
Insight represents the conclusion of the data analysis process. A case manager thought she noticed an uptick in food assistance needs towards the end of the month and thought perhaps the agency should focus on connecting clients with CalFresh. However, when she analyzed the data, she found that the majority of her clients already receive CalFresh. By using Looker data she was able to determine that an agency-wide focus on CalFresh applications wouldn’t address clients’ food insecurity. Most clients enrolling at her agency already receive CalFresh, and for whatever reason still need food assistance before their next disbursement. Because of the case manager’s data analysis, the agency can now strategize ways to best help clients with additional food assistance and resource management.
Developing Data Analysis Questions
In data analysis and data science, practitioners often say all analysis begins with a question. There are a number of considerations and parameters to take into account when trying to solidify the question you want to answer with HMIS data Looker. Let’s look at an example scenario.
Your agency is not a victim service provider, but you’ve noticed more than a few clients enrolling at your agency are fleeing domestic violence. You have identified a funding opportunity to serve clients who are fleeing domestic violence with more specialized services. Exploring your HMIS data is a great way to get information about the work you’re already doing to help bolster your grant application.
When you begin the data analysis process, you’ll need to break your data analysis question into three parts:
- Who - Who does your question concern? Is it all clients, or a more specific demographic segment such as clients over or under a certain age, of a certain gender, or of a certain race or ethnicity?
- What - What interests you about this group? What do you need to know about them?
- When - What is the reporting period of your question?
In our example, the "who" is all clients, the "what" is those fleeing domestic violence, and the "when" is the last fiscal year (7/1/19 - 6/30/20). This leaves us with our data analysis question: “How many clients fled domestic violence to our agency in the last fiscal year?” This question gives us direction for selecting the fields and parameters we’ll need to use in Looker.
Looker’s Interface
Accessing Looker
To build reports in Looker you need to get to the Explore tab:
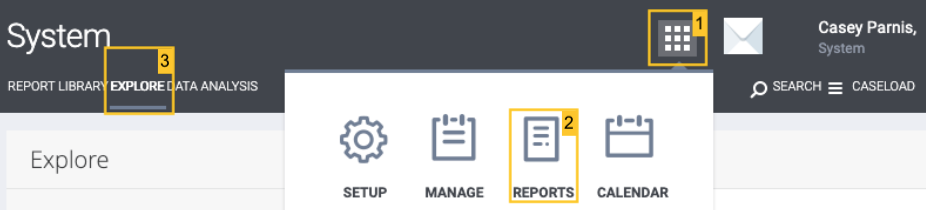
- Click the menu button on the HMIS home screen.
- Click Reports.
- Click the Explore tab.
Looker Models
When you click on the Explore tab you will be taken to a page where you choose the model of data you want to work with. Models, in Looker’s words, are “customized portal[s] into the database, designed to provide intuitive data exploration.” Essentially, models are buckets of data containing related data fields.
Generally, you will only need to use one of the following four models:
- HMIS Performance - Requires clients to have a project enrollment during your reporting period to appear.
- Client Model - Clients do not need an enrollment during your reporting period to appear.
- Services Model - For data about services your agency has provided and recorded in HMIS.
- Project Descriptor - Contains information about your agency and project setup, bed inventory, and staff.
Click the “OPEN” link next to the model you need to begin. To follow along with our example of clients entering a project after fleeing domestic violence, click the “OPEN” link next to the HMIS Performance model.

Looker Report Screen
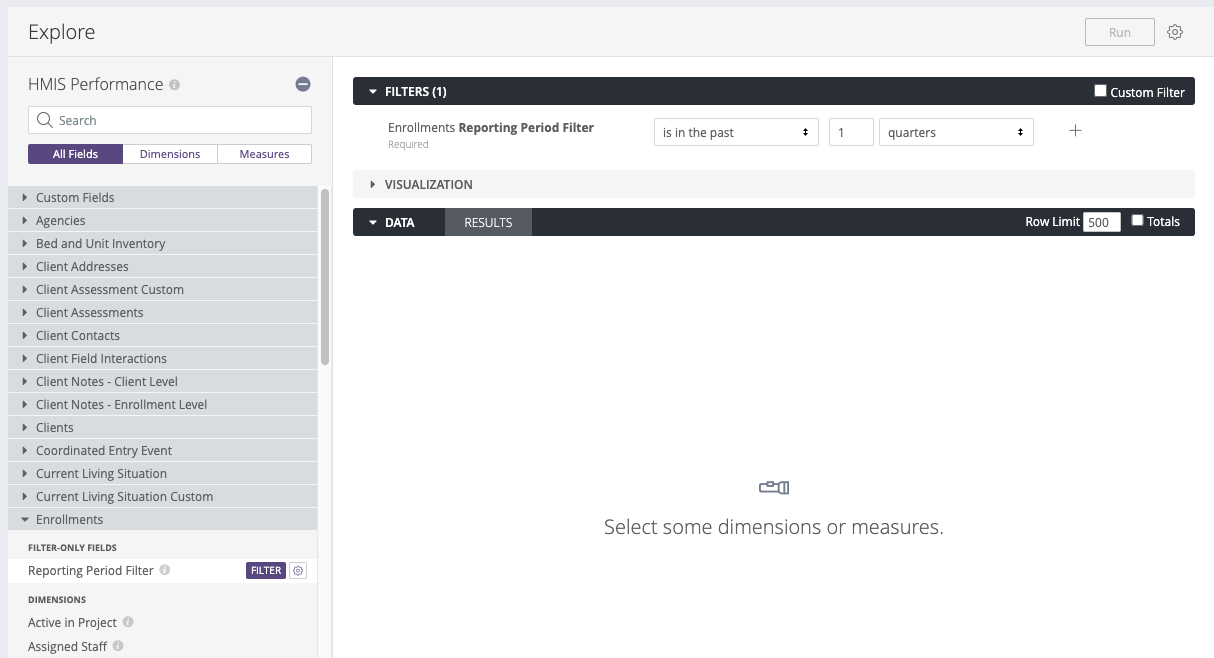
Once you select your model, you will be taken to this is the screen where you will pull data for your data analysis projects.
Field Pane

On the left hand side of the screen, you’ll find the field pane. This pane is where you’ll select the fields you want to include in your data analysis project, both in the data you want to export and how to filter that data.
When you get started with Looker, you should take some time to scroll through the different segments of fields and click on the dropdown arrows to familiarize yourself with the locations of fields for easy access later. You can also search for fields using the search box, or filter the field pane for only dimensions or only measures using the selection boxes under the search bar.
To add a field to your report, simply click on it in the field pane.
Filtering

The topmost section of the report screen is the filter section. This is where you’ll determine how to filter the data you want to pull.
Looker automatically applies the Enrollments Reporting Period filter which allows you to filter for clients active in whatever reporting period you specify. The default is in the past quarter. You can adjust these dropdowns to suit the reporting period you need. You can also create multiple criteria for the same field being used as a filter, click the plus button next to the filter after you’ve added your first criteria to add another.
Keep in mind that when creating date filters in Looker you need to add one day to the end of your reporting period. For example, if your reporting period is 1/1/2019 to 12/31/2019, you should enter 1/1/2020 as your end date in Looker. This is because Looker calculates the end of the reporting period using “until before” logic. In our example, we’re telling Looker to pull data on clients active “until before” 1/1/2020, which comes out to 12/31/2019.

You can use almost any field as a filter. To do so, find the field you want to use, hover over it, and click on the Filter button that appears next to it.
Data Pane

The data pane is where you’ll see the results of your report. If you are building a particularly large report with more than 10-15 columns or using multiple custom dimensions or filters, it may be helpful to reduce the Row Limit. The Row Limit determines how many rows Looker generates for you in the data pane as a preview of your data. Reduce your Row Limit to help your report generate faster.
Dimensions vs. Measures
While you scroll through the field pane and click on field section dropdowns, you’ll notice in each field section there are dimension fields in gray text that appear first and measure fields in gold text that appear last.


Dimensions make up the bulk of your field options. Dimensions can be thought of as an attribute or characteristic used to group data, such as client age or enrollment project start date. Dimensions are almost always pulled directly from HMIS. The Clients Unique Identifier Dimension field pulls the identifier number you see on the client’s Profile Screen under the space for their picture, and the Enrollments Project Start Date field pulls each enrollment’s project start date from the project start date field on the enrollment screen.
Measures can be thought of as ways to group data from dimensions. Measures are not pulled directly from HMIS, rather they are a type of calculation using HMIS data. Examples of measures include Count of Clients and Average Income Change.
Selecting Fields
To get the most out of Looker, you need to understand how it works and what its limitations are. Like any reporting tool, you can only get out what you put into Looker.
HUD is fond of the saying “If it’s not in HMIS, it doesn’t exist.” That could not be more true of Looker! Looker has no way of using information that exists outside of HMIS, so it’s important to understand what you’ve put in to HMIS before you start trying to extract knowledge from Looker.
Let’s go back to our example of looking for the number of clients served in the last fiscal year who fled domestic violence situations directly to our project. We’ve identified our Who, What, and When for this question, and now we have to determine how to pull that data from Looker.
The "who" for our question asks “How will we identify our clients?” If the raw data is to be emailed, uploaded to the cloud, or otherwise shared electronically, you should use the Clients Unique Identifier or Clients Personal ID dimensions. Clients Unique Identifier gives you the identifier number you see under the client’s profile picture. Clients Personal ID gives you the number at the end of the URL when you are viewing the clients Profile Screen, and selecting Clients Personal ID also creates a link directly to the client’s Profile Screen that you can click on from Looker. Clients Personal ID is useful for reports that are meant to be run on the Data Analysis tab for cleanup and identifying data quality issues.
The "what" for our question asks “What are we interested in about our group of clients?” We are interested in whether they fled domestic violence right before entering our project. Luckily, this is a HUD data element and is easily accessible in Looker. We will use the Entry Screen Currently Fleeing Domestic Violence dimension.
Finally, the "when" for our question is “What is our reporting period?” We are interested in clients who enrolled in the project during the last fiscal year which is July 1st, 2019, to June 30th, 2020. We are not interested in all clients who were active in the project during that time, so we will set the Enrollments Reporting Period filter to any time and we will enter our date range in the Project Start Date FIlter. Remember, in Looker we have to add an extra day to the end of our reporting period, so our Project Start Date Filter will be 7/1/2019 to 7/1/2020.
Screen Specific Fields
The What part of our data analysis question requires the Entry Screen Currently Fleeing Domestic Violence dimension. This dimension’s name starts with “Entry Screen” because fields that collect the same information can appear on multiple screens. Screens are organized into sections in the Looker field pane.
Fields in the clients section generally pull from the Profile Screen. The Entry Screen section contains HUD standard data elements that appear on the Enrollment Screen, and the Entry Custom section contains custom fields the Orange County Continuum of Care has added to the Enrollment Screen such as Employment Status, “What state were you born in?”, and any fields that are specific to private funders.
The Update/Exit Screen sections function the same as the Entry Screen sections in terms of where you’ll find HUD standard data versus custom data, but they pull from either the status update or annual assessment screen, or the exit screen.
You can identify a field’s section by looking at the non-bold part of the field description once you’ve added it to the data pane:

Special Note: If you are working with any field from a "Custom" bucket (Entry Custom, Assessment Custom, etc.) and your field pulls no data, please enter a ticket with the HMIS Help Desk so we can ensure that the custom field has been given permission to update in Looker.
Exporting Looks
If you’re following along with our example data analysis question “How many clients fled domestic violence to our agency in the last fiscal year?” let’s try creating a report we can export to Excel for some initial analysis. Downloading this report and analyzing the results in Excel is an easy way to explore data if you don’t plan on exploring this particular data very often. After we learn how to analyze this data in Excel, we’ll look at a few ways to put in some work upfront in Looker to make this data more accessible in the future.
Set up the report page with the filters and fields below:

As you set up your report, think about other types of reports that might be useful for you to export from Looker. You might be familiar with the [GNRL-220] Program Details Report report that you can access on the Reports page. This report pulls all of a client’s information from a certain screen for you, which can be very useful for a thorough review of enrollments, but maybe you don’t need quite so much information.
Perhaps there are a subset of fields you frequently work with whether for reporting on your agencies’ activities, or for data quality cleanup that you can add to a custom Looker report. Creating custom detail reports in Looker is a great way to see exactly what you need without having to work around data that is not useful to you.
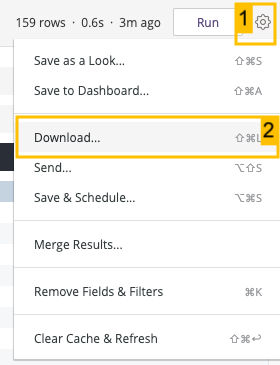
To download your report:
- Click on the gear icon in the top right corner
- Select Download from the dropdown
When you click download another screen will appear with options for your download:

- File Format - For this example, change the file format to Excel Spreadsheet (Excel 2007 or later). There are other download options such as image files and PDF which can be useful when creating visualizations.
- Results - Optional, but good practice to change your Results option to “As displayed in the data table” so the column headers on your Excel report will match the headers you see in the data pane. This will be especially important if you create a report that uses the same field from the Entry screen and the Update or Exit screen.
- Values - Generally, you can leave your values as formatted. This means your download will be an Excel file that differentiates a text field from a date field from a currency field.
- Limit - change your Limit to “All Results” to make sure you see all of the data that has been captured by your filters. If you leave this as “Results in Table,” you will only download the number of rows that appear in your preview which is defaulted to 500.
- Filename - Here you can adjust the name your file will download and save as.
Simple Data Analysis In Excel
Filtering and PivotTables are two quick and easy ways to accomplish simple data analysis in Excel.
Filtering in Excel

Once you open your Excel file, you can apply a filter to your report and use filters to look at your clients who fled domestic violence directly into your project:
- Click the Filter button in your home ribbon
- Click Filter from the dropdown menu that appears
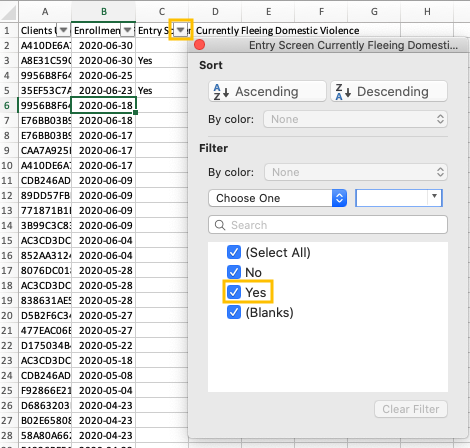
After you click Filter you’ll notice dropdown arrows appear on the header cell of each column. To filter any column, click the dropdown arrow that appears next to it.
For our example, we want to see how many clients fled domestic violence immediately prior to project entry. To do that, we’ll click the dropdown arrow next to the Entry Screen Currently Fleeing Domestic Violence column, then click Select All to clear the filter selections, and click “Yes” to only see clients who answered yes to this question.
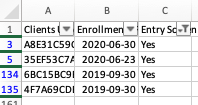
The result of our filtering process shows us that we have 4 clients who enrolled in the project immediately after fleeing domestic violence.
PivotTables in Excel

To create a PivotTable:
- Click the Insert tab at the top of your screen
- Click the PivotTable button
A popup screen will appear with your data surrounded by a green dashed line asking you to confirm that this is the data you want to create a PivotTable for. Click “OK” to create your PivotTable.

Excel will create a new tab in your workbook for the PivotTable.
There are a few different ways you could organize your PivotTable to show you the number of clients in your report who fled domestic violence. In this example the Entry Screen Currently Fleeing Domestic Violence field is in the rows section so you can see the distribution of “No”, “Yes”, and Blank responses. The values are a count of the clients’ identifiers.
For more information on PivotTables, check out Microsoft's guidance:
Data Analysis in Looker
Answering our data analysis question of “How many clients fled domestic violence to our agency in the last fiscal year?” is simple in Looker and does not require any exporting.
To make things a little easier, we will adjust how we set our report up. Earlier we discussed using fields as filters in Looker, that functionality will make our analysis a lot easier here.
In our data analysis question we are not concerned with clients who were not fleeing domestic violence because we just need a count of clients who are fleeing domestic violence for our grant application. You might be interested in all clients’ relation to this question if you wanted to look at the proportion of clients who have x attribute or experience, we’ll cover that in the advanced topics section.

Our reporting period filters are exactly the same, enrollments reporting period filter is set to any time and enrollments project start date is set to FY19-20.
To only see clients who fled domestic violence, we will use the Entry Screen Currently Fleeing Domestic Violence field as a filter set to “Yes.” To get a count of everyone who answered the Entry Screen Currently Fleeing Domestic Violence field with a “Yes” we will use the Clients Number of Clients measure in the data pane.
Just as with our Excel analysis, we see there are 4 clients who fled domestic violence into the project in FY19-20.
Notice in the screenshot there are numbers in shaded ovals in some of the field sections. These numbers indicate how many fields are being used from each section. In our example we have one field from the Clients section which is the Number of Clients measure. There are two from the Enrollments section which are the Enrollments Reporting Period Filter and the Enrollments Project Start Date. There is one field from the Entry Screen section which is the Entry Screen Currently Fleeing Domestic Violence field.
Saving Looks
To save your Look for future use, click the purple Save Look button and enter a descriptive name in the popup that appears. Your saved Looks will appear on the Data Analysis tab under the System Reports dropdown.

Advanced Topics
Looker provides the advanced functionalities of custom fields and visualizations for report and field customization. It’s important to note that these features take time and practice to use effectively, and you shouldn’t feel intimidated or discouraged by these topics. If you are just starting out with Looker there is no need to use any of these features until you are more comfortable creating your own reports.
Custom Fields
Custom dimensions, measures, and table calculations allow you to dive deep into your HMIS data and can save you a lot of time if you need to regularly report on the same metrics. Custom fields are only applied to the report you are working on when you create it. In order to use a custom field on multiple reports, you will need to copy the code for each custom field into a text or word processing document and save it on your computer or a cloud based service for future use. Each of the custom field functions are related but meet different data analysis needs.
It’s also important to keep in mind that since custom fields are created by individual users, they are not HUD standard, they are not monitored by 211OC, and as such are not as reliable as the built in fields you’ll find in Looker. They are powerful tools but require a deep understanding of HMIS data to be used effectively.
You will need to familiarize yourself with Looker’s expressions, functions, and operators in order to effectively use custom fields:
Custom Dimensions
Custom dimensions should be used when you want to combine one or more dimensions. Dimensions are essentially attributes or characteristics which make up the bulk of the fields you’ll find in Looker. Custom dimensions require the use of Looker’s proprietary syntax which is somewhat similar to Excel’s equation syntax. If you have created formulas in Excel, Looker’s syntax should look familiar to you.
An example of a custom dimension could be “Female clients entering the project from a place not meant for human habitation.” This custom dimension combines the Clients Gender dimension and the Entry Screen Residence Prior to Project Entry dimension to let you see this specific population.
You can combine dimensions that are not in your report into a custom dimension. For example, you can select the Projects Full Name dimension and your custom “Female clients entering the project from a place not meant for human habitation” dimension as the only data you see in the data pane and the dimension will still calculate based on the Clients Gender dimension and the Entry Screen Residence Prior to Project Entry dimensions even though they do not actually appear as columns in your report.

To create a new custom dimension:
- Click the Custom Fields dropdown
- Click New
- Click Custom Dimension
As an example, we will create a custom dimension that identifies whether or not an enrollment belongs to a female client who enrolled in the project from a place not meant for human habitation.

When you open the custom dimension panel you’ll see a place to name your custom dimension. Try to make this as descriptive as possible.
Next, you’ll see a dropdown menu for your dimension’s formatting. Usually the default formatting will work well, especially if you are outputting whole numbers or text. If you are outputting a decimal number, date, or currency, you can adjust for this formatting in the formatting dropdown.
The custom dimension expression panel is where you will create your custom dimension. This is similar to the formula bar in Excel. This process will require experimentation and reference to Looker documents such as the Operators and Expressions articles linked above.
As you create your dimension you may get stuck on an error which will appear to the right of the custom expression panel. Click the “Help + Syntax Reference” link at the bottom of the panel for help on the error you receive.
Our example of female clients entering the project from a place not meant for human habitation is categorizing clients based on whether or not they are female AND entered the project from a place not meant for human habitation.

if((${static_demographics.gender} = 0 AND ${entry_screen.prior_residence} = 16), "Yes", "No")
We start off with an IF expression, followed by our first parentheses. Since we have multiple criteria in this expression, we need to add a second parentheses that will hold in our criteria before we move on to our outputs.
Start searching for your dimensions by typing a dollar sign followed by a curly bracket. This will bring up a list of dimensions which you can keep typing in to narrow down further. Type “gender” to find the “static demographics gender” field, and enter “= 0” to indicate that we only want to look at client records where the gender is equal to 0. This number refers to the field number listed in the HMIS Data Dictionary:

Some fields in looker require the data dictionary’s field number and some require the actual text of the response option you’re looking for. Unfortunately, this will require trial and error to figure out. Looker is releasing a data dictionary function in the future which will hopefully help with this step. In the meantime, if you aren’t getting the results you need, make sure to try both the HMIS data dictionary’s field number and the response option text.
Next type AND to indicate that there is an additional criterion our results need to meet and repeat the process for the residence prior to project entry field. The 16 you see in the expression is also a field number from the HMIS Data Dictionary.
Close the first parentheses to indicate that you have added all of your necessary qualifications.
For this example, we have used “Yes” and “No” as our outputs but you can use any text as an output. “Yes” is used in the first position (“value if true”) to indicate that if our criteria are met Looker should output “Yes” for that row, and No is used in the second position (“value if false”) to indicate that the row does not meet our criteria.
You could also use a code such as “FPNH” where we used “Yes” to indicate that the row belongs to a female client entering from a place not meant for habitation if you were to use this custom dimension in a larger report.

Using the custom dimension we just created as a field in your data pane will yield results like this. From here, you could complete analysis in Excel, use this custom dimension as a filter, or use it as part of a larger report.
Custom Measures
You can create custom measures by following the steps we just used for creating custom dimensions, this time selecting “Custom Measure” from the custom fields section.

You can also click the gear icon next to any field to create a custom measure based on that field and selecting the type of measure you want to create. Before creating a custom measure, look through the list of measures that already exist in each field section in Looker. Bitfocus has added many measures to Looker that should cover most of your data analysis needs.
Table Calculations
Since table calculations require all of the fields you want to calculate with to be present in your report, table calculations should be used when you want to narrow in on data you’ve already pulled.
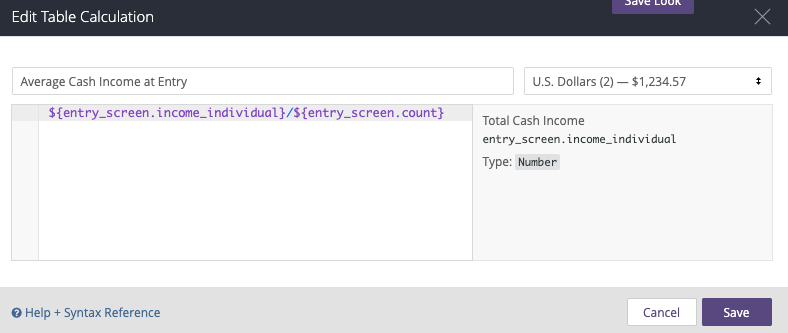
In this example, we have pulled a report using the using Programs Full Name field to show the name of the agency and project on each row, the Enrollments Count measure to show the number of enrollments in each project, and Entry Screen Total cash income to show the total amount of income recorded at entry in each project. We can use a table calculation to show the average amount of income at entry by opening the table calculation module (which is the same process as for the custom dimension and custom measures), and entering our calculation here.
First, name the calculation something descriptive.
Then select the appropriate formatting from the formatting dropdown. In this case, it makes sense to change the formatting from default to US dollars with cents.
Finally, create the calculation by dividing the number of enrollments by the total cash income in the report. Upon clicking save, a new column titled Average Cash Income at Entry will appear in the report.
Visualizations
Visualizations are ways to show aggregate data other than plain numbers or text.

Here we have modified our first example data analysis question of clients entering the project directly from a domestic violence situation to show aggregate data. You can do this by adding the Entry Screen Currently Fleeing Domestic Violence dimension and the Count of Enrollments measure into the data pane. You can now see how many enrollments answered the question by each of the response options.
In order to visualize this data properly, we need to think about what the data actually entails. We know that only adults are required to answer Data Element 4.11 asking if they have ever experienced domestic violence. We could add a filter for adults only to our data to narrow it down so that only enrollments where the question is required will appear.
We also know that only clients who answered Yes to that first question in Data Element 4.11 are asked the follow-up question of “Are you currently fleeing?” This is an even easier way to filter our data down to only see enrollments where the question applies. Add a filter for Entry Screen Domestic Violence is equal to Yes to narrow down our data. Now we can choose a visualization.
Click on the visualization dropdown to open up the visualization pane.

In order to look at the context of all of our clients who said they had experienced domestic violence at some point in their lives and determine how many of them were currently fleeing domestic violence, we could select a pie chart which shows us the percentage of each response option. When using a pie chart keep in mind that it can be difficult for people to accurately gauge the size of the pie’s slices so it’s important to always keep data labels visible on a pie chart. It is also recommended to not use a pie chart if you have more than 4 categories of data to visualize.
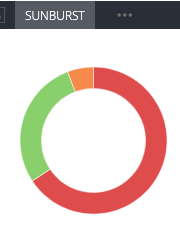
The dot menu in the visualization pane opens up a dropdown menu with even more visualization options. You can select sunburst from this dropdown to see a type of pie chart with an empty space in the middle, sometimes also referred to as a donut chart.

In order to see how common each answer is, we could use a bar chart that will rank the response options from greatest to least. A bar chart is a reasonable choice for most data analysis you’ll be doing in Looker. It doesn’t work for everything, but when you’ve got categorical data bar charts are generally a good jumping-off point.

If you need to keep track of single metrics, the card visualization might work best. Here we’ve also added a filter to only show us clients fleeing domestic violence since we are focusing on that number.
Choosing a visualization for your data analysis project is a skill that will get easier and more intuitive with practice. Below are some resources for deciding on which visualization to use:

